On 2 November 2026 we read 60 data analyst listings for Kolkata on Naukri, and 39 of them tagged neither SQL nor Python. That count does not prove those jobs involve no code, because each listing shows only a handful of skill tags. It does show why data analytics without coding is a fair question for commerce and arts students. This guide covers where you can start without programming, which tools carry you, and when a little code starts paying off.
Yes, you can start data analytics without coding, but the job decides how far that goes
Plenty of real analysis happens inside spreadsheets and dashboard tools. A beginner can clean a messy sales file in Excel, summarise it with a pivot table and build a chart without any code. Power BI then turns that same data into a dashboard that a manager can filter by month or region.
Think about what a small company actually needs from a junior. It needs the monthly numbers to be correct, on time and easy to read. The owner of a Kolkata distribution business rarely cares which tool produced them.
Roles such as MIS Executive and Reporting Analyst often live in this world. Their daily output is a report that someone reads and acts on, so accuracy matters more than programming style.
The honest limit appears when data grows. Companies rarely keep their numbers in one neat file, because most of it sits in databases. Someone has to pull that data out, and SQL is the usual way to do it.
Python enters later, for automation or forecasting work. So the short answer has two parts:
→ You can begin learning and land some entry-level reporting work with Excel and Power BI alone.
→ You will reach more jobs, and usually better ones, once you add basic SQL.
Be wary of any page that promises a full analyst career with no code ever. Our sample below shows that Python and SQL both appear in Kolkata listings, including junior ones.
What does a data analyst actually do all day?
Tools make more sense once you see the work itself. Here is a made-up example from an FMCG distributor in Kolkata, written only to show the flow.
Every month, the sales head wants to know why biscuit sales fell in North Bengal. The analyst receives a file with 40,000 rows, some with spelling errors in the district names. Fixing those errors comes first, and that step alone can take a surprising share of the day.
Next comes the question behind the question. Did sales fall everywhere, or only in two districts? Perhaps one distributor stopped ordering altogether. A pivot table answers both in minutes once the data is clean.
The final step is telling the story. A one-page dashboard shows the two weak districts, and a short note suggests calling those distributors first. The sales head never sees the 40,000 rows and only needs the answer.
Notice how little of that needed programming. Careful thinking, business sense and clear communication did most of the work. Those skills also happen to be things that non-technical students often bring from commerce, economics or management study.
Which data analytics tools work without coding?
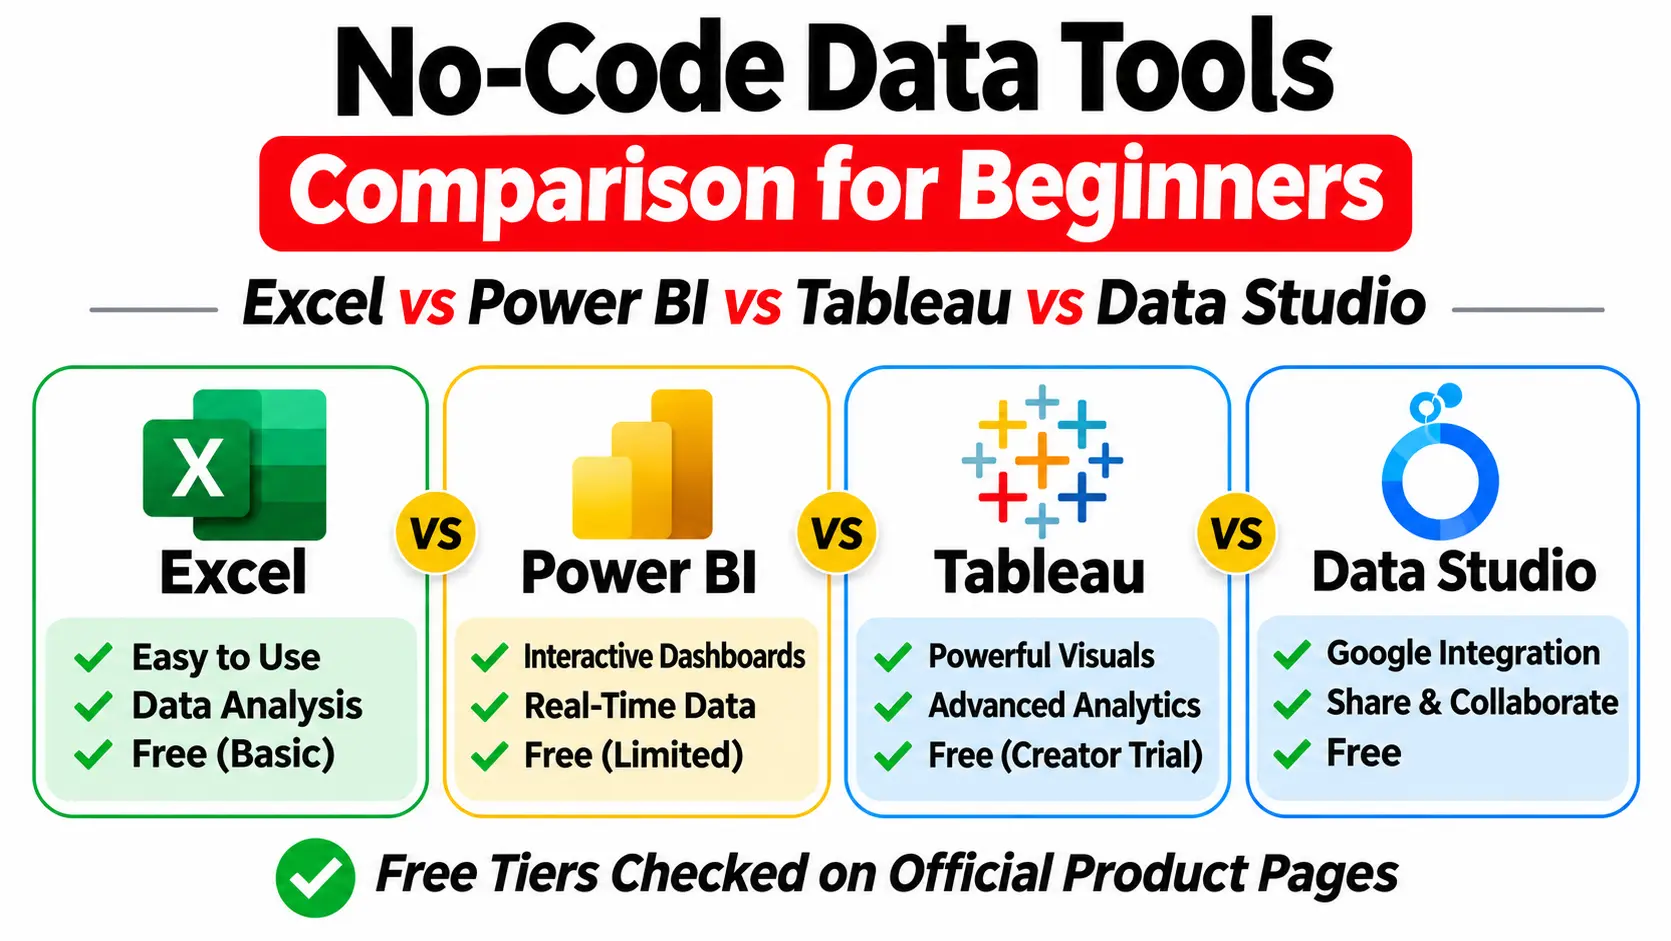
Four tools cover most beginner work, and three of them cost nothing to try. We checked the free tiers on the official product pages on 2 November 2026.
| Tool | What you use it for | Code needed | Cost |
|---|---|---|---|
| Excel | Cleaning, formulas, pivot tables, quick charts | None for most work, macros use VBA | Paid licence, check Microsoft for the current price |
| Power BI Desktop | Interactive dashboards and reports | Drag and drop first, DAX formulas later | Free to build reports, says Microsoft |
| Tableau Public | Charts and a public portfolio | Drag and drop | Free, but your work is shared publicly |
| Google Data Studio (formerly Looker Studio) | Web dashboards from Sheets and other sources | Drag and drop | No charge for creators and viewers |
One piece of honesty about Power BI belongs here. Basic charts really are drag and drop, but serious reports use DAX, a formula language that feels like harder Excel. Microsoft’s PL-300 study guide expects proficiency in Power Query and DAX. DAX is not programming in the Python sense, yet it still demands logical thinking.
Excel deserves your first month, because almost every other tool assumes you understand rows, columns and totals. Learn how to remove duplicates, split messy text, use lookups and build a pivot table. Those four habits alone will handle a surprising amount of office reporting.
Power BI comes next, and it connects naturally to what you learned in Excel. You load a file, tidy it in Power Query, then drag fields onto a page to make charts. Power Query remembers your cleaning steps, so next month’s file takes far less time.
Tableau Public works well as a portfolio, since anyone can open your charts through a link. The catch is that your work is public, so never upload real company data there. Google’s Data Studio suits anyone already working in Google Sheets.
Only 3 of the 60 Kolkata listings we read tagged Tableau, so we would learn Power BI first in this city. That is a judgement from one small sample, and you should test it against the jobs you want.
Is SQL coding, and do you really need it?
SQL is technically a language, but it reads more like a polite question than a program. Here is a short query that asks for total sales by region:
SELECT region, SUM(sales) AS total_sales
FROM orders
GROUP BY region;
Most beginners can read that after one explanation. You are asking for two columns from one table, grouped by region. No loops, classes or software design are involved at this stage.
Students with an arts or commerce background often expect SQL to feel like engineering and then find it closer to Excel logic. Joins take more practice, because you combine two tables and small mistakes can quietly double your totals.
So do you need it? Your first week of learning can happily skip it. A wider job search is different, because SQL or database skills were the most common technical tag in our sample. Treat it as the first step past no-code rather than a wall you must avoid.
Four keywords carry you a long way at the start, namely SELECT, WHERE, GROUP BY and JOIN. Learn them on a small table first, so you can check each answer by eye.
What Kolkata job listings ask for right now
We read the first three pages of Naukri’s data analyst listings for Kolkata on 2 November 2026, and removed duplicates. Entry-level here means a minimum of 0 or 1 year of experience.
| Skill tag | All 60 listings | 17 entry-level listings |
|---|---|---|
| SQL or database | 13 | 3 |
| Python | 12 | 5 |
| Excel | 11 | 4 |
| Power BI | 10 | 3 |
| Tableau | 3 | 1 |
Please read this table with care. It covers one day, in Naukri’s relevance order, and listings show a capped number of tags. A job description can ask for far more than its tags reveal, so 39 listings without SQL or Python is a hint and nothing stronger.
Two employers show how wide the range can be. Digital Glyde listed a 0 to 3 year role tagged with Excel and Power BI. Nova Technologies listed a 0 to 1 year role tagged with SQL. Python led the small entry-level group by one or two tags, which is a useful warning against assuming junior jobs never touch code.
Where should a complete beginner start?
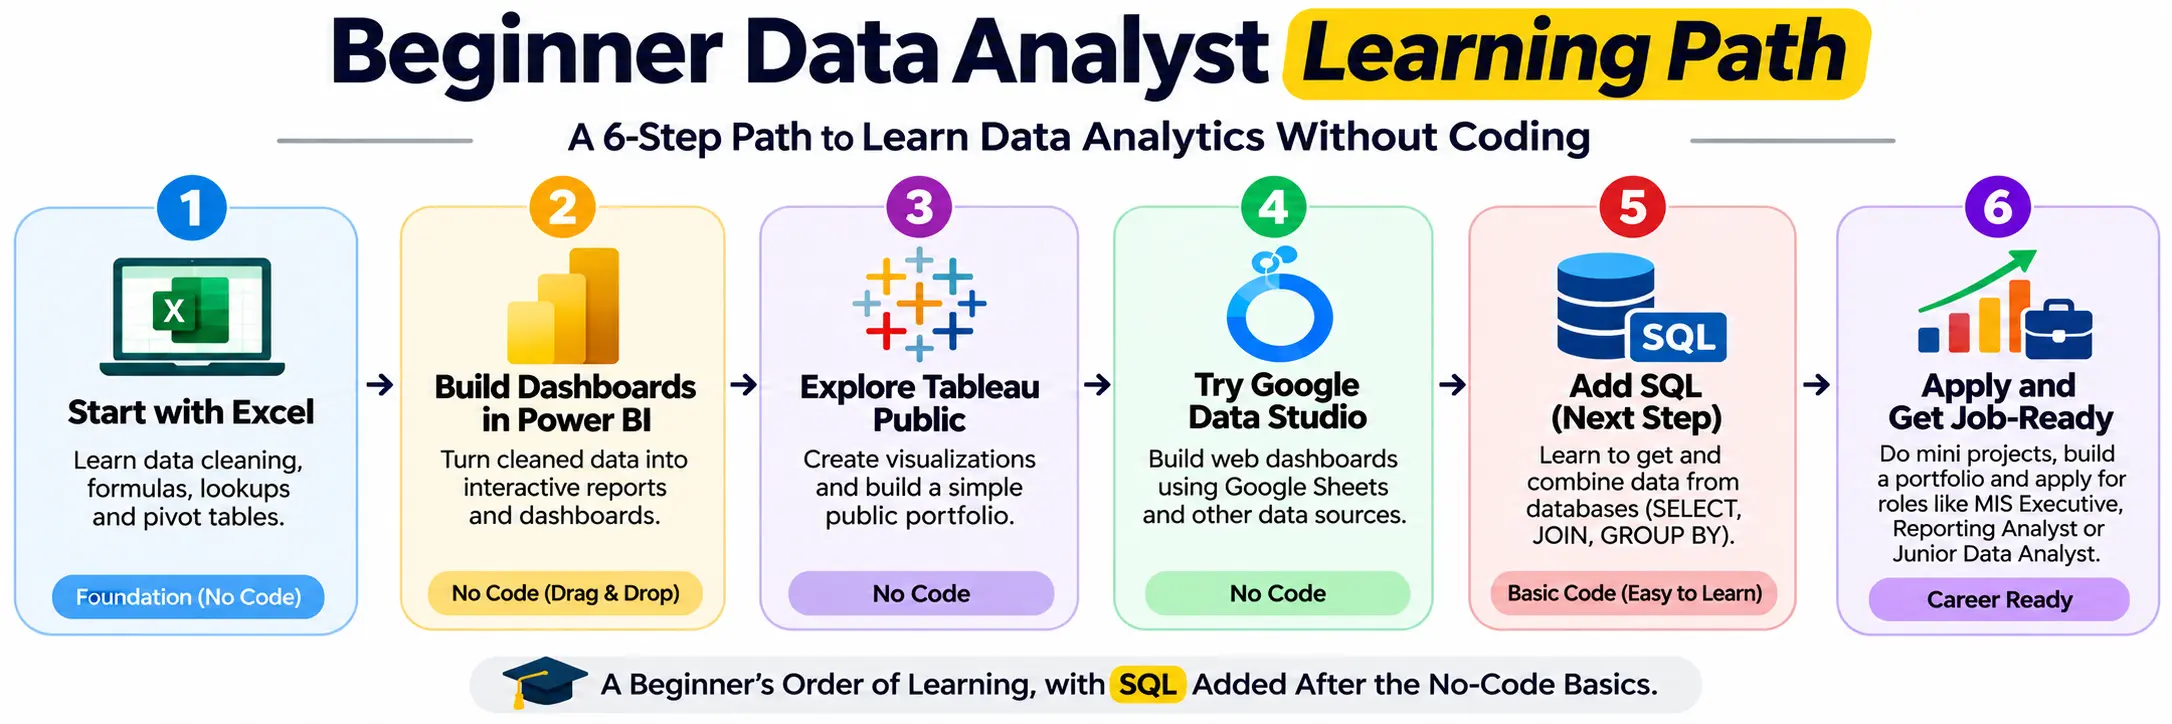
Order matters more than speed here. This sequence keeps you producing visible work from the first month:
1. Learn Excel properly, including cleaning, lookups and pivot tables, using one real-looking sales file.
2. Pick up basic statistics, such as averages, percentages, distributions and the difference between correlation and cause.
3. Build two dashboards in Power BI from data you cleaned yourself.
4. Learn SQL basics, up to simple joins, and rebuild one earlier report using a query.
5. Finish two small projects that answer a business question, and write a short note on each.
6. Apply for entry-level roles while you keep practising, because job descriptions will tell you what to learn next.
Two small project ideas suit a complete beginner:
→ Build a monthly sales report for a made-up shop, showing the best products, weak months and one clear suggestion.
→ Turn a public dataset on a topic you enjoy, such as cricket scores, into a one-page dashboard.
Write a few lines under each project explaining the question, the steps and what you found. Recruiters skim, so those lines can matter as much as the chart itself.
Sample data needs one quick warning. Microsoft’s sample files are handy for practice, but they are partly fictitious and meant for reference use. State clearly in your portfolio that a dataset is a sample, and never present it as a real client result.
Our guide on how to become a data analyst in Kolkata covers the wider route. For project ideas, read what a data analytics course with live projects should really make you build.
Which jobs can you apply for without coding?
Job titles vary between companies, so read the duties rather than the label. These four are the most realistic starting points for someone with strong Excel and Power BI skills:
→ MIS Executive: You prepare regular reports, usually in Excel, for managers. Awesome Analytics listed a 1 to 4 year role tagged with Excel, macros and MIS.
→ Reporting Analyst: You build and maintain dashboards, then explain the changes each month.
→ Business Analyst: You turn business questions into requirements and reports. Vmock listed a 0 to 2 year role with this title.
→ Data Verification Analyst: You check data for accuracy against rules. Foundation AI listed a 0 to 5 year role under this title.
Treat those employer names as examples from one day’s listings, since openings change quickly. Salary questions need their own space, so our data analytics career in Kolkata guide covers pay with sources and sample sizes.
Do you need a course, or can you learn alone?
Self-study works if you can stay disciplined and find someone to review your work. A course mainly buys you structure, feedback and deadlines.
Before paying anyone, ask one blunt question: when does Python enter the syllabus, and is it optional? A course sold as no coding may still add Python partway through. Ask for the week-by-week syllabus, then mark every week that needs Python or R. Even the Google Data Analytics Certificate, which asks for no experience, teaches SQL and R alongside spreadsheets and Tableau. Google quotes three to six months at under ten hours a week.
Compare your options through our Top 10 data analytics institutes in Kolkata list and our beginner courses guide.
Read ten Kolkata job descriptions before you pick a tool
You can begin data analytics without coding, using Excel and Power BI, and reach real entry-level work that way. SQL widens your options later, and Python matters more for advanced roles. This week, open ten Kolkata job descriptions and write down every tool they mention. That short list will tell you exactly what to learn first.
Frequently asked questions
Q.1 Can I become a data analyst without coding?
You can reach entry-level reporting and MIS roles with Excel and Power BI. Most analyst roles beyond that expect at least basic SQL, so plan to learn it within your first few months.
Q.2 Is coding necessary for data analytics?
Coding is not necessary to start, and much daily analysis happens in spreadsheets and dashboards. It becomes more useful as data grows, or when a job needs automation and forecasting.
Q.3 Is Excel enough for a data analytics job?
Excel alone can get you some MIS and reporting roles. In our Kolkata sample, Power BI and SQL appeared about as often as Excel, so learning all three gives you far more choice.
Q.4 Can arts or commerce students learn data analytics?
Yes, and many courses accept them. Commerce students often understand sales and finance data well, which helps them ask better questions. Check each course’s entry rules and syllabus before paying.
Sources
→ Naukri, data analyst jobs in Kolkata, read 2 Nov 2026
→ Microsoft, PL-300 study guide
→ Google Data Analytics Certificate

I am Ance John, a Content Writer with 6 years of experience in creating informative, engaging, and SEO-friendly content. I specialize in career guidance, education, professional development, digital marketing, and industry trends. My goal is to simplify complex topics and provide valuable insights that help students, freshers, and working professionals make informed career decisions. Through my content at Kolkata Skills, I focus on institute guides, career roadmaps, skill development, and educational opportunities in Kolkata.